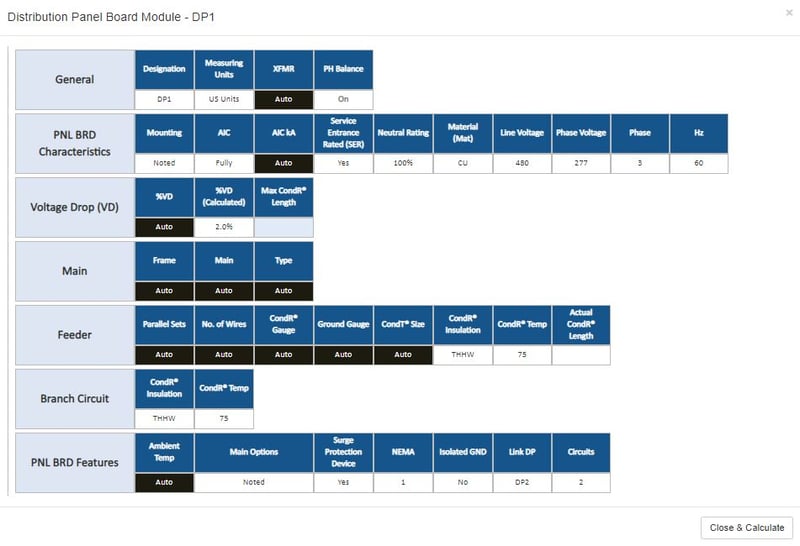
Fig 1: Settings on Panel WIZARD
In our last article Design Build: Better Estimates for Electrical Costs, we walked you through the basics of how to use PowerCalc for estimates of electrical costs for increased accuracy in design build projects.
Ultimately, the goal of using PowerCalc in this process is to increase (1) the profitability of design build projects by avoiding underestimating with the contractor absorbing costly mistakes, or alternatively, (2) the competitiveness of the contractor's bid by improving the pricing process to reflect actual costs.
So, let's take another look at the details. Start with the Panel Wizard as pictured in Fig 1. Set up each panel overriding the pre-set
"Auto" functions. Instead, input your estimates for the "Panelframe" and "Main" sizes.
Once these two values are input, then PowerCalc jumps into action automatically calculating all corresponding values: sizing and quantifying equipment and associated conductors (with neutral and ground), conduits, overcurrent protection devices, panel frame, main frame, phase, equipment AIC ratings,voltage drop, and fault current calculations.
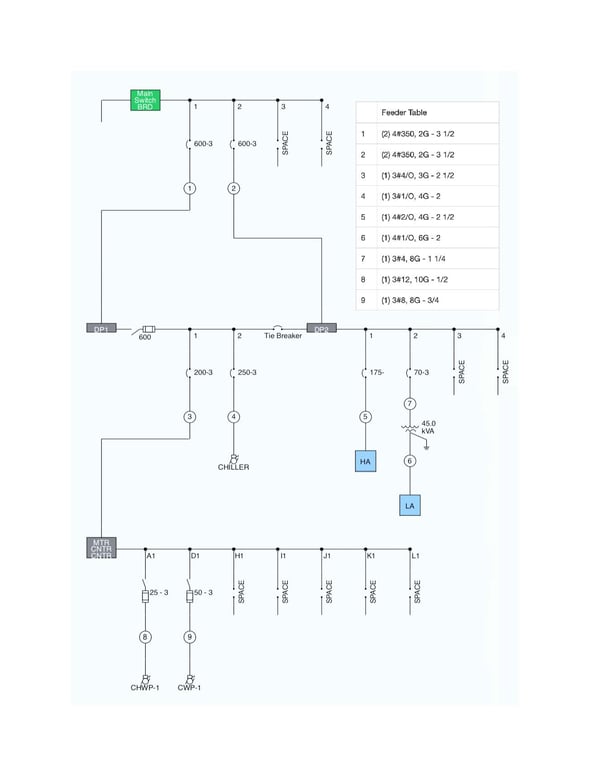
While the user is imputing values into the Panelboard WIZARD (or alternatively on the panelboard itself - the WIZARD is just easier / faster), PowerCalc's 1 Line Diagram is automatically and simultaneously generated providing a basic layout of the facility's power distribution system.
PowerCalc's 1 Line Diagram is not a "click-drag" process with the user providing specifications. Instead PowerCalc's 7.5 million calculations, enable the placement of all required equipment on its 1 Line Diagram with all specifications automatically and simultaneously populated with each and every input on the WIZARD. All in compliance with NFPA 70, the National Electrical Code (NEC). Virtually, no guess work or "real" work for the user.

Fig 2: 1 Line Diagram: PowerCalc with Feeder Table
In short, estimates based on PowerCalc's calculations allow the design bid quote to be much closer to actual cost.
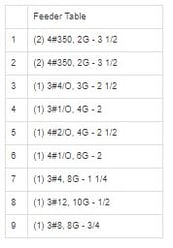
 Fig 3: Feeder Table from PowerCalc's 1 Line Diagram
PowerCalc's 1 Line Diagram summarizes the power distribution system on the graphic itself indicating the power distribution components such as distribution panels, lighting / power panels, feeders, overcurrent protection devices, generators, Automatic Transfer Switches (ATSs), motor control centers (MCCs), and more. Included with the 1 Line Diagram is the Feeder Table indicating the number and size of feeders / conductors.
The information generated by PowerCalc's 1 Line Diagram can also be viewed and checked on PowerCalc's eNODE(tm) table where it is provided in a graphic format. eNODE The eNODE maps the power distribution system and aggregates the information from all panels, schedules, and modules to indicate the electrical load by type, demand load, transformer size, and connectivity. It lists the electrical NODEs of the power distribution system. Each electrical NODE represents an electrical point of connection on the power distribution grid in the facility.
Also useful for a Design Build estimate, is PowerCalc's function of instantaneously updating for any change. Change an input anywhere on the design, and all values on the power distribution system and 1 Line Diagram are instantaneously updated across the entire power distribution system, both upstream and downstream.
Among the many reasons to use PowerCalc for such estimates is that only PowerCalc can provide details like sizes and quantities for necessary equipment as outlined above. While still estimates, the quantity and sizing of equipment results in an estimate much closer to "actual" costs especially compared to estimates generated by other means.
And remember, we have a free demonstration on the first Friday of each month: FREE Demo, Friday July 10th at 12 pm EST Hope you will join us!
Thank you for your support! Stay well.


